Ventricular Pressure Volume Loop
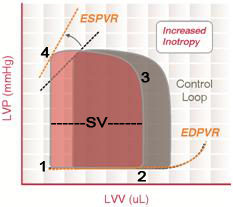
This left ventricular pressure volume (P-V) loop shows two loops superimposed on one graph. The grey loop represents the control or normal P-V loop and the pink loop represents a P-V loop with increased inotropy. This image was taken from the wikicommons site. It has been labeled further with numbers by the author of this keyword. Because the pink loop is a little easier to visualize, we will use it to demonstrate the various phases and points on a ventricular P-V loop.
1. At point 1, the mitral valve opens as left atrial pressure exceeds left ventricular pressure, and this begins ventricular diastolic filling, lasting from points 1 to 2.
2. Point 2 corresponds to left ventricular end diastolic pressure and volume. At point 2, the left ventricular pressure exceeds left atrial pressure and causes closure of the mitral valve. The phase between points 2 and 3 is known as the isovolumic contraction phase during which the left ventricular pressure increases but left ventricular volume remains unchanged.
3. Point 3 corresponds to opening of the aortic valve and the beginning of ventricular ejection as the left ventricular pressure exceeds aortic diastolic pressure that opens the aortic valve. Phase 3-4 is the ejection phase of ventricular contraction.
4. At point 4, aortic pressure exceeds left ventricular pressure, ventricular ejection ceases and this causes closure of the aortic valve. Point 4 is also known as the end systolic pressure and volume of the left ventricle. The phase from points 4 to 1 is known as isovolumic relaxation, the volume in the left ventricle is constant but the left ventricular pressure is declining.
Stroke volume is the width of the P-V loop, labeled as SV on the loop. It is the difference between end diastolic volume and end systolic volume.
ESPVR stands for end systolic pressure volume relationship and EDPVR stands for end diastolic pressure volume relationship. These curves change based on changes in contractility, afterload and preload. For example, in our loop above, the increased inotropy loop (pink loop) shows a shift in ESPVR upward and to the left (increasing the slope).
EDPVR reflects the diastolic elastance of the left ventricle since change in pressure (P) divided by change in volume (V), ΔP ⁄ ΔV, reflects elastance or stiffness of the ventricle. The elastance increases as the left ventricular volume increases and as volume becomes larger, the relationship becomes a curve (not a straight line). This upward deflection of the curve reflects that the heart becomes difficult to overfill above a certain volume.

Copyright Information

This work is licensed under a Creative Commons Attribution-NonCommercial-NoDerivatives 4.0 International License.