Key Points
- Detecting fluid responsiveness is critical in fluid management in a perioperative patient. A patient’s volume status varies throughout cardiac and respiratory cycles.
- Static variables such as central venous pressure, pulmonary artery occlusion pressure, inferior vena cava diameter, and left ventricular end-diastolic volume allow one to assess volume status at a single time point.
- Dynamic variables such as pulse pressure variation, systolic pressure variability, stroke volume variation, plethysmographic variability index, inferior vena cava collapsibility, and distensibility and velocity time integral variation can be generally used to guide fluid management in perioperative and critically ill patients. However, these variables have limited validity in certain clinical scenarios.
Physiology of Fluid Responsiveness
- Fluid responsiveness is typically defined as an improvement in left ventricular stroke by 10-15% volume with approximately 500 mL of intravenous fluid administration.
- There is an intricate relationship between ventilation and circulatory output that can be further exaggerated with positive pressure ventilation (Figure 1).
- With inspiration, there is an increase in pleural pressure and a decrease in transmural pressure, resulting in increases in pressures in the superior vena cava, pulmonary artery, pulmonary veins, and the right atrium. These pressure changes are countered by an increase in vascular resistance, which negatively affect flow and results in a decrease in venous return to the right side of the heart.
- Additionally, a reduction in transmural pressure in the pulmonary veins results in diminished vascular volume, which causes the emptying of the blood into the left side of the heart. Left ventricular preload is therefore transiently increased with increased blood volume and improved diastolic filling in the setting of already decreased right heart volume. This is evidenced by a momentary elevation in systolic blood pressure. However, over time, with decreased right heart preload, the left ventricular preload and stroke volume are also reduced, which causes an eventual decline in systolic blood pressure.

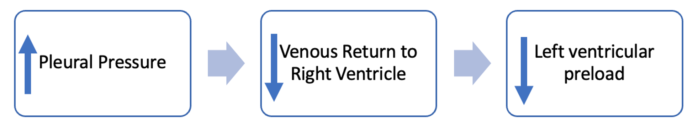
Figure 1. Effect of positive pressure ventilation on cardiac output
- Positive pressure ventilation causes fluctuations in systolic blood pressure where an initial increase at early inspiration followed by a decrease at the end of inspiration.
Dynamic Variables
Pulse Pressure Variation (PPV)
- Pulse pressure is the difference between systolic and diastolic blood pressure, and it varies with respiration during positive pressure ventilation.
- PPV is a dynamic marker that can be used to determine if a patient is a fluid responder. PPV can be calculated using the following equation:

- Using an arterial line, maximal and minimal pressures are calculated during the same respiratory cycle. If the PPV is greater than 12%, then the patient is a fluid responder.4 In mechanically ventilated critically ill patients receiving tidal volumes of at least 8mL/kg, PPV can detect volume responsiveness with a sensitivity of 88% and specificity of 95% with a threshold of 12%.
- PPV cannot be reliably used in the following situations:
- Spontaneous ventilation
- Low tidal volume (4mL/kg) in a mechanically ventilated patient
- Pulmonary hypertension
- Decreased lung compliance
- Open thoracic cavity
- Arrhythmias
- Increased abdominal pressure
Systolic Pressure Variability (SPV)
- SPV can be used in a mechanically ventilated patient to identify a volume responder.
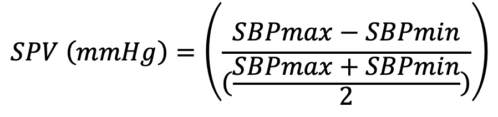
- The above equation is used to calculate SPV, where SBPmax and SBPmin are obtained from the arterial waveform. SPV greater than 10mmg Hg is indicative of a fluid deficit and can be used to determine fluid responsiveness.2
Stroke Volume Variation (SVV)
- Similar to PPV and SPV, SVV can be used to determine fluid responsiveness and is calculated using the following equation:

- SVV greater than 13% is consistent with a volume responder. SVV is typically calculated using invasive and noninvasive monitoring devices.3,4 Argos™ (Retia Medical, White Plains, NY, USA) utilizes information from an arterial line and uses Multi-Beat Analysis (MBA™) to estimate stroke volume, SVV, and cardiac output. FloTrac/Vigileo™ (Edwards Lifesciences, Irvine, CA, USA) estimates SVV using information from an arterial line via FloTrac sensor, and data can be visualized on its monitor. While Argos and FloTrac require invasive hemodynamic monitoring, ClearSight™ (Edwards Lifesciences, Irvine, CA, USA) uses a finger cuff to estimate the same data.3,4
- The presence of any cardiac arrhythmias, valvular abnormalities, markedly altered lung and chest compliance, and elevated intraabdominal pressure can cause variations in stroke volume irrespective of a patient’s volume status, and therefore, SVV cannot be used reliably in these situations to predict fluid responsiveness.
Plethysmographic Variability Index (PVI)
- PVI describes the difference in the perfusion index that occurs during the respiratory cycle. Perfusion index (PI) is the percentage of light absorbed during arterial pulsation with increased blood and total light absorbed during the nonpulsatile state. Most pulse oximetry devices have the ability to display PI continuously. With PI values, PVI can be obtained using this equation:

- In comparison to spontaneous breathing, during mechanical ventilation, the pulmonary pressures are relatively stable, and PVI has a slightly greater accuracy for detecting perfusion changes and assessing for fluid responsiveness.5 A PVI of 13% is typically observed in a fluid responder. However, placement of pulse oximetry probe (ear vs. fingertip) and/or vasopressor use can affect the PI. This makes PVI a less reliable marker for volume assessment in these circumstances.
Clinical Tests
Passive Leg Raising Test
- Passive leg raising (PLR) test allows a clinician to directly observe the response to augmented cardiac output by simulating a fluid bolus. To accurately test for fluid responsiveness during hypotension, the patient is positioned in a semi-recumbent position with the head of the bed at 45-degree angle, as shown in Figure 2, with the legs extended, and a baseline cardiac output is obtained. The bed is then positioned to elevate the legs, as shown. This positional shift will mobilize approximately 300 mL of fluid from the legs to the central venous system, thereby increasing the preload in the right heart, which would increase the cardiac output by 10% if the patient is a volume responder.1 Cardiac output measurement is superior to arterial blood pressure in predicting hemodynamics that will improve with volume expansion.6
- The Surviving Sepsis Campaign and the European Society of Intensive Care Medicine have included PLR as a reliable assessment tool in their resuscitation guidelines. PLR can also be used with spontaneously ventilating patients. With increased abdominal pressure, venous return is compromised. Therefore, PLR has limited utility given the impediment of flow to the right heart.6
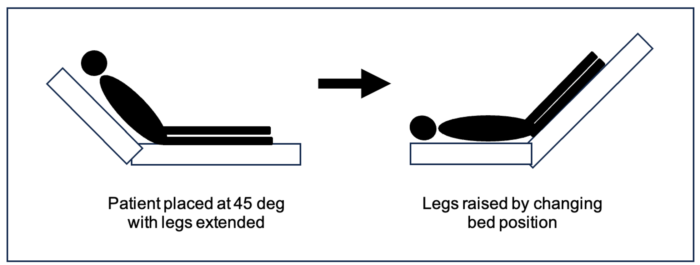
Figure 2. Passive leg raising test. The patient is positioned with the head of the bed raised to 45 degrees elevating the torso while the legs remain flat. The position is shifted to elevate the legs 45 degrees above the heart to augment preload. The cardiac output is measured at baseline (on the left), which is compared to the cardiac output with a change in position (on the right).
End-Expiratory Occlusion Test
- In situations where PLR cannot be used, the end-expiratory occlusion (EEO) test is an alternative for volume assessment during passive ventilation. At the end of expiration, ventilation is paused for 15 to 30 seconds while evaluating for any changes in the cardiac output. With a ventilatory pause, physiologically, there is an increase in venous return to the right side, thereby increasing the preload resulting in an augmented cardiac output. Measured cardiac output greater than 5% from baseline is indicative of fluid responsiveness.7
Echocardiography
Inferior Vena Cava (IVC) Diameter
- Transthoracic echocardiography is a beneficial tool that can be used at the bedside in almost all patients to evaluate volume status and predict response to volume expansion. Please see the OA summary on IVC POCUS for more details. Link
- From the subxiphoid view, the IVC diameter can be visualized. It is a static parameter that approximates the central venous pressure (CVP) or right atrial pressure. IVC diameter less than 2.1cm is consistent with right atrial pressures between 0 – 5mm Hg and a diameter greater than 2.1 cm is indicative of pressure between 10 – 20 mm Hg. However, similar to CVP and pulmonary artery occlusion pressure (PAOP), the diameter of IVC when used alone is a poor marker for volume responsiveness.7
- On the contrary, the variance of the IVC throughout the respiratory cycle, a dynamic marker, can be used to evaluate for a positive response to volume8 (Figure 3). The collapsibility of the IVC can be calculated using the following equation:

Where Dmax is the maximal diameter and Dmin is the minimal diameter during the respiratory cycle
- A collapsibility index greater than 12% is indicative of a volume responder in a spontaneously ventilating patient. Likewise, in mechanically ventilated patients, the distensibility of the IVC can be measured via:

- A volume response is predicted if the distensibility index is greater than 18%.8
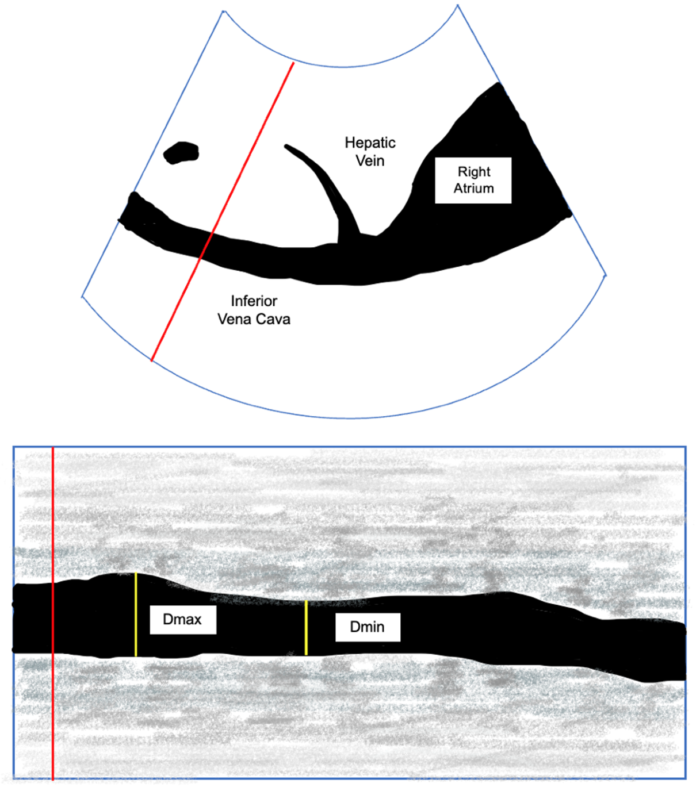
Figure 3: IVC in the subcostal view with Doppler (Top). M-Mode view of the IVC with maximum (Dmax) and minimal diameter (Dmin).
Left Ventricular Outflow Tract (LVOT)
- A patient’s volume status can also be assessed by evaluating the LVOT, which serves as a surrogate marker for SVV. In the parasternal long-axis view, the LVOT diameter can be measured at 0.5 cm into the ventricle from the aortic cusp insertion. In the apical 5-chamber view, a Doppler signal placed across the LVOT and tracing along the ejection is calculated to be the velocity time integral (VTI) representing the blood flow during the cardiac cycle. Similar to stroke volume, variation in VTI is observed during the cardiac cycle and is calculated using:

Where VTImax is the highest, and the VTImin is the lowest VTI during as measured during 10 cardiac cycles.
- VTI variation has a threshold of 15.9% to detect a volume responder with a sensitivity of 87.5% and specificity of 95%. In septic patients on mechanical ventilation, VTI variation greater than 12% is indicative of volume expansion.4
- Additionally, a series of calculations using the LVOT diameter and VTI can be used to estimate the cardiac output.

Where the SV is calculated by the following equation:

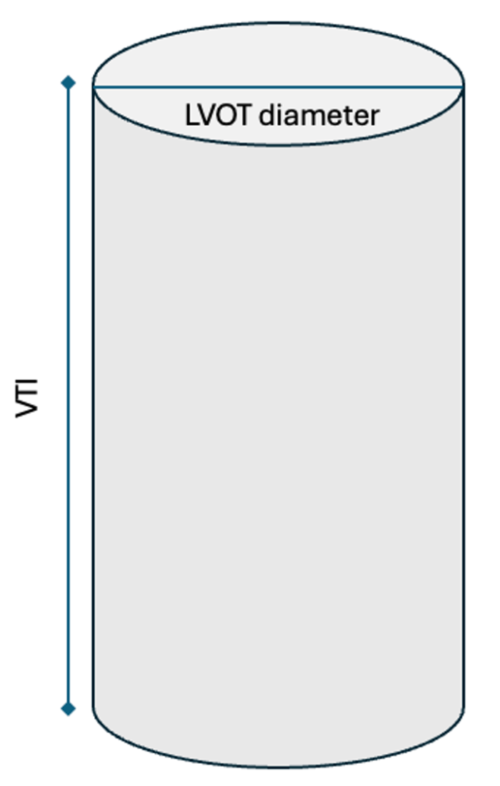
Figure 4. Cylindrical representation of the LVOT. LVOT is the diameter of the cylindrical structure. VTI or the SV is the area of the entire cylinder.
- LVOT VTI can also be used with the PLR test. An increase in VTI greater than 12% is indicative of volume responsiveness.
- Evaluating the LVOT has limited validity in patients with aortic stenosis, subaortic obstruction, dynamic obstruction in hypertrophic cardiomyopathy, hypertension, and the elderly patients.9 Additionally, the measurements can be variable and user dependent.
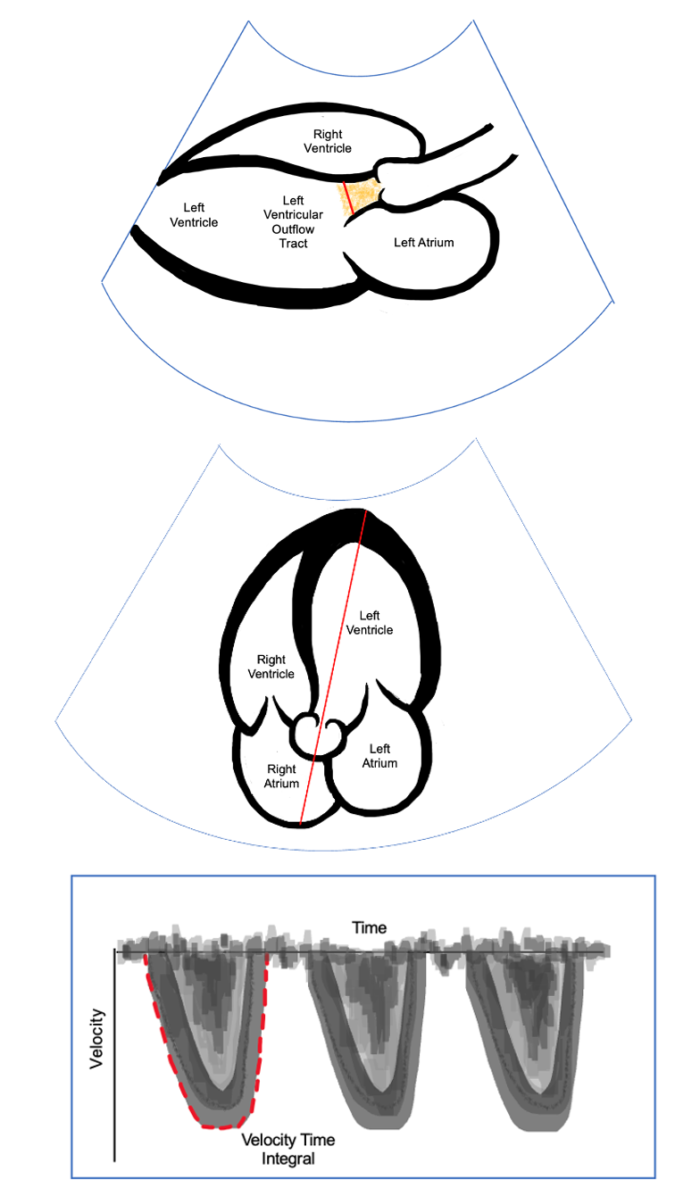
Figure 5. Parasternal long-axis view. The diameter of the LOVT is measured as shown in red. Apical 5-chamber view with Doppler across the LOVT (Middle). Doppler placed as shown in red to obtain VTI by tracing around the curve (Bottom).
References
- Jozwiak M, Monnet X, Teboul JL. Prediction of fluid responsiveness in ventilated patients. Ann Transl Med. 2018;6(18):352. PubMed
- Mathis MR, Schechtman SA, Engoren MC, et al. Arterial pressure variation in elective noncardiac surgery: Identifying reference distributions and modifying factors. Anesthesiology. 2017.126(2): 249-59. PubMed
- Hadian M, Kim HK, Severyn DA, et al. Cross-comparison of cardiac output trending accuracy of LiDCO, PiCCO, FloTrac and pulmonary artery catheters. Crit Care. 2010;14(6):R212. PubMed
- Michard F, Boussat S, Chemla D, et al. Relation between respiratory changes in arterial pulse pressure and fluid responsiveness in septic patients with acute circulatory failure. Am J Respir Crit Care Med. 2000;162(1):134-8. PubMed
- Chu H, Wang Y, Sun Y, et al. Accuracy of pleth variability index to predict fluid responsiveness in mechanically ventilated patients: a systematic review and meta-analysis. J Clin Monit Comput. 2016;30(3):265-74. PubMed
- Monnet X, Marik PE, Teboul JL. Prediction of fluid responsiveness: an update. Ann Intensive Care. 2016;6(1):111. PubMed
- Gavelli F, Teboul JL, Monnet X. The end-expiratory occlusion test: please, let me hold your breath! Crit Care. 2019;23(1):274. PubMed
- Thomas M, Morrison C, Newton R, et al. Consensus statement on clear fluids fasting for elective pediatric general anesthesia. Paediatr Anaesth. 2018;28(5):411-4. PubMed
- Wang J, Zhou D, Gao Y, et al. Effect of VTILVOT variation rate on the assessment of fluid responsiveness in septic shock patients. Medicine (Baltimore). 2020;99(47):e22702. PubMed
Copyright Information

This work is licensed under a Creative Commons Attribution-NonCommercial-NoDerivatives 4.0 International License.